
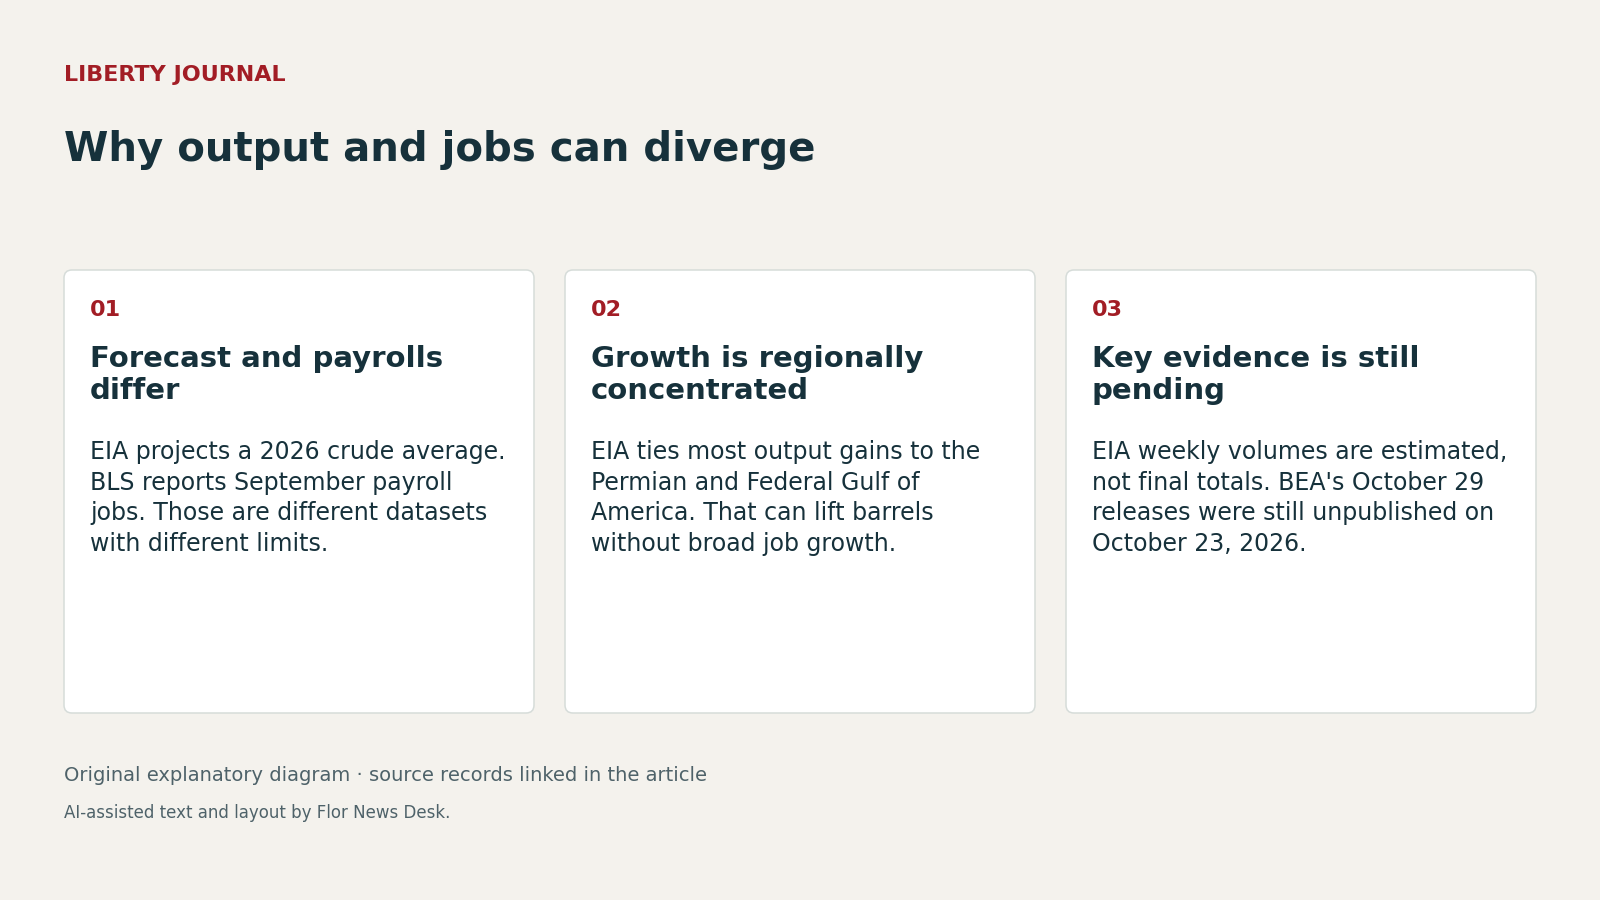
On September 10, 2026, the U.S. Energy Information Administration said its September Short-Term Energy Outlook projected U.S. crude oil production to average 13.8 million barrels a day in 2026, above the prior annual record of 13.7 million barrels a day in 2025 (EIA analysis). But the Bureau of Labor Statistics’ industry chart for September 2026 shows oil and gas extraction employment at 114.1 thousand, down 0.6 thousand from one month earlier and down 1.8 thousand from a year earlier (BLS industry chart).
That juxtaposition is not a contradiction. It is a reminder that output and payrolls are different measures, collected for different purposes. The EIA page is a 2026 production forecast, not a final annual result, and its output story is geographically concentrated: the agency says first-half 2026 production averaged 13.7 million barrels a day, up 2 percent from first-half 2025, with most expansion in the Permian region of Texas and New Mexico and the Federal Gulf of America (EIA analysis). The BLS chart, by contrast, is a seasonally adjusted payroll count. It does not tell readers which basin, project, or employer drove the change (BLS industry chart).
That distinction matters for a pro-production argument. More barrels strengthen domestic supply even if payrolls do not rise in lockstep. EIA says Permian production is forecast to average 6.8 million barrels a day in 2026, and it credits part of the Gulf increase to Shenandoah, Ballymore, Whale, and Salamanca coming online since 2025 (EIA analysis). As analysis, those facts support a narrow conclusion: if incremental supply is coming from a concentrated set of prolific regions and large projects, national extraction employment can be flat or down while output still climbs. The federal record does not prove that mechanism, but it is consistent with it.
The weekly production table suggests the output side of the story remained strong into early October, with U.S. crude production estimates at 13,899 thousand barrels a day for the week ending September 11, 13,954 thousand for October 2, 13,888 thousand for October 9, and 13,721 thousand for October 16 (EIA weekly table). Still, EIA notes that the Lower 48 weekly figures are estimated using short-term forecasts, so those numbers are not final observed monthly totals. They can show high output territory; they cannot settle the full-year result by themselves.
For Liberty Journal readers, the practical takeaway is mixed but important. The bullish supply case is intact in the federal record: domestic crude output is projected at record levels, and weekly estimates remain near that range (EIA analysis; EIA weekly table). The weaker point is jobs. BLS shows not just oil and gas extraction down modestly over one, three, six, and 12 months, but the broader mining, quarrying, and oil and gas extraction category down 2.1 thousand in September to 566.9 thousand (BLS industry chart). Those payroll figures do not measure wages, hours, profits, or household fuel prices.
The next macro releases were still pending as of October 23, 2026. The Bureau of Economic Analysis schedule lists the advance estimate of third-quarter 2026 GDP and September 2026 Personal Income and Outlays for October 29, 2026 (BEA schedule). Those releases may help show whether national output and incomes strengthened. They will not, by themselves, explain why extraction payrolls softened. On the evidence now public, the safest conclusion is narrower: U.S. oil supply appears strong, but measured national extraction hiring has not kept pace.